Content-to-Asset Conversion Rate as a Marketing Ops Metric
Measuring which content actually moves deals forward, not just gets published.

Most marketing ops dashboards measure two things well: how much got made and how many people saw it. What they skip is the question sitting right between those two numbers: how many of those assets actually produced a qualified action? That's the blind spot, and it sits exactly where creative output is supposed to turn into pipeline contribution.
Call it a resource allocation problem, because that's what it costs a team. A content calendar can look full and productive while still leaving the pipeline starved, and a dashboard full of green checkmarks for "published" tells a team nothing about whether any of it moved a deal forward.
AI-assisted production doesn't fix this. The ability to generate drafts, images, and decks faster than ever sounds like relief from a volume problem, but if the feedback loop between production and outcome was already broken, speeding up the input side just means more unconverted assets piling up at the same broken exit. More content without a way to measure what it does is not progress; it's a bigger haystack with the same number of needles.
What's missing is a unit of measurement that sits at the intersection of two things that are usually tracked separately: production activity and pipeline outcome. Something that asks not "how much did we make" and not "how many people saw it" but "how much of what we made actually did its job." That's the gap content-to-asset conversion rate is built to close.
What content-to-asset conversion rate measures
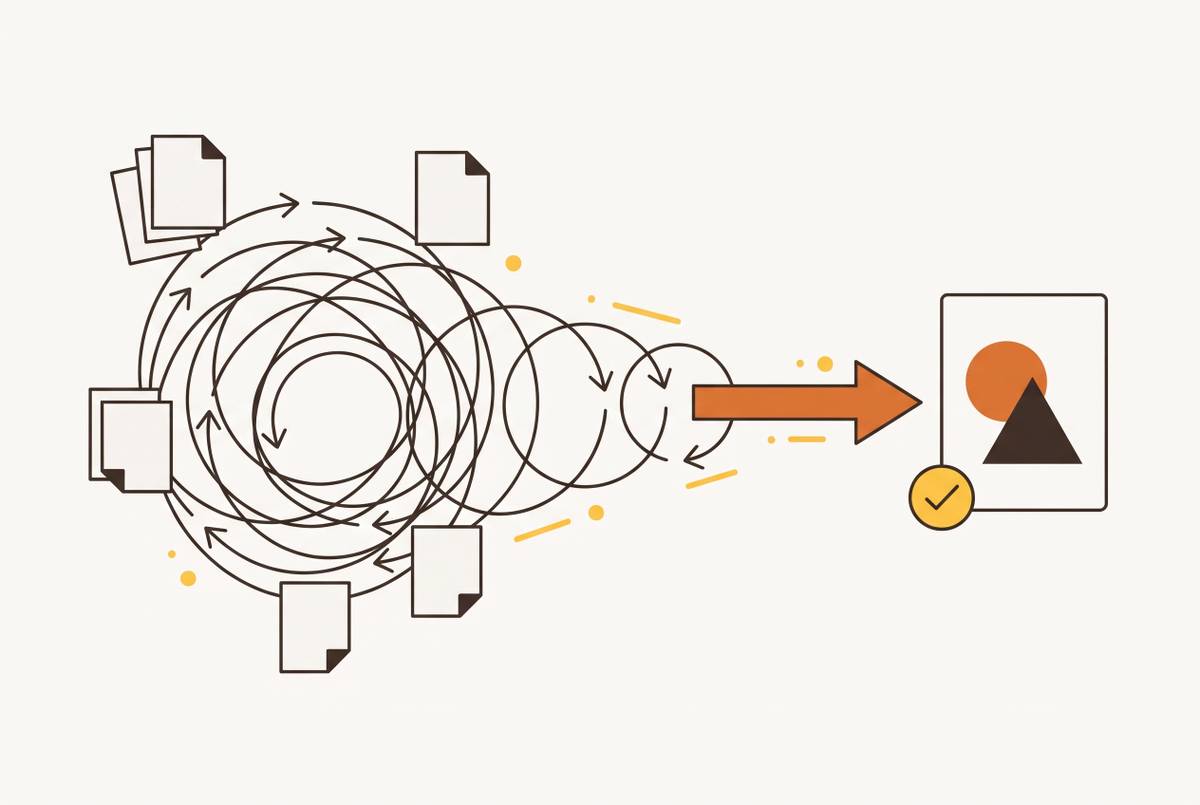
Content-to-asset conversion rate, C2ACR, is a pipeline efficiency metric. It has nothing to do with traffic. It cares about yield: of everything that enters the production pipeline as a brief, an interview transcript, a research doc, how much comes out the other end as a finished, deployed asset that produced a tracked result.
This distinction reframes the whole question of what "content performance" means. C2ACR doesn't ask whether people liked what got published. It asks whether the pipeline is actually manufacturing usable output.
Consider two teams side by side. Team A commissions twenty content briefs a quarter and ships four decks from them, sixteen of which stall somewhere between research and design. Team B ships eighteen decks from those same twenty briefs but gets zero demo requests from any of them. Both teams have a conversion problem. They do not have the same conversion problem. The metric needs to track three different failure points rather than collapsing them into one score: a volume failure, where not enough raw material enters the pipeline; a format-fit failure, where content gets built into the wrong asset type for the funnel stage it's meant to serve; and a conversion gap, where the right asset ships at the right stage and still produces nothing.
C2ACR is distinct from conversion rate by content asset, a downstream metric that measures how well an already-finished piece converts the people who see it. C2ACR measures something upstream of that: how many of the inputs entering the pipeline become finished, converting assets. The two metrics nest inside each other rather than compete. A low score on one doesn't tell you anything about the other. Tracking only one of them leaves half the picture dark.
How to calculate C2ACR and set a working baseline
The formula is plain enough to run in a spreadsheet without any special tooling. Before measuring anything, a team has to agree on what counts as "deployed and outcome-producing," because an asset that was emailed to twelve people and never opened again shouldn't count the same as one that drove a booked meeting. A reasonable starting threshold for most B2B teams: the asset has to be distributed to an audience and produce at least one tracked action, a form fill, a click to a conversion page, a meeting booked.
| Stage | What gets counted |
|---|---|
| Upstream | Briefs approved, research docs completed, SME interviews captured, copy drafts cleared for design |
| Downstream | Assets published or distributed, assets with at least one logged conversion event |
| Leakage | Inputs that stalled in review, revision, or design queue, or that published but were never distributed |
Setting a baseline doesn't require new infrastructure. Divide the last number by the first. That ratio is the starting C2ACR.
That gap between the expected number and the actual one isn't a failure of the exercise, it's the useful part: the size of that gap is the starting point for figuring out which of the three bottlenecks is actually in play.
The three C2ACR bottlenecks
A low score doesn't explain itself. Two teams can post the same low score and be dealing with completely different problems. The number has to be cross-referenced against pipeline stage data before anyone draws a conclusion about whether the issue is upstream, midstream, or downstream.
Volume failure looks like a thin input pipeline relative to how much the team is trying to distribute. The fix direction here runs toward expanding the content calendar, repurposing material that already exists into new formats, and capturing SME knowledge before whoever holds it forgets the details or changes roles.
Format-fit failure is sneakier. Production volume can look healthy, deployment rate can look fine, and conversion still craters, because what's shipping is built for the wrong stage of the funnel. The fix is to audit where in the buyer journey each existing asset is actually being used and rebuild or redistribute from there, not to make more content.
Conversion gap is the bottleneck where everything upstream worked. The asset got made, it got deployed at the right stage, and it still produced nothing. Reach can look meaningful here with conversion sitting near zero, and the causes tend to cluster around weak or missing calls to action, design quality that undercuts the asset's credibility, visuals that aren't finished enough to earn attention in whatever channel they're running in, or distribution that happens without any follow-up to close the loop.
Three bottlenecks, three different diagnoses, three different fixes. Treating a low C2ACR as one undifferentiated problem is how a team ends up solving the wrong one.
Shifting the bottleneck from creation to governance
AI tools have made the first bottleneck, the volume failure, much easier to avoid. That's a real unlock, and it means teams that once struggled to keep the pipeline fed can now test more campaigns, more variants, more formats, in less time.
But here's the pivot: speeding up creation doesn't resolve the other two bottlenecks, and it actively strains the review processes meant to keep output on-brand. When production velocity jumps, that same review process turns into a chokepoint, and visual drift, mismatched typography, off-brand colors, inconsistent tone across asset types, accumulates faster than a manual reviewer can catch it.
This produces a strange, specific failure pattern: a team can have a high input-to-asset ratio, lots of briefs becoming lots of published assets, while its asset-to-conversion ratio sits low at the same time. AI solved the creation bottleneck. It did not solve, and in some cases actively exposed, the conversion gap sitting right behind it.
The teams closing that gap are building design systems that enforce brand consistency at the moment of creation, pushing governance into the generation step itself rather than bolting it on afterward through a review queue. That means locked design tokens, templates, and approval logic built into the production tool rather than handled by a human checking each asset after the fact.
It also means a shift in who's doing the work. Now it's governance and taste, and that puts pressure on the tool layer to do work a trained designer's eye used to do by instinct.
Closing the conversion gap with editable, on-brand visual assets
Most teams have enough written content sitting around. The conversion gap bottleneck is rarely a copy problem. It's a finishing problem: raw material doesn't convert anyone, and a finished, visually credible asset is what actually earns attention and trust from a buyer deciding whether to take the next step.
There's an operational detail here that's easy to underestimate: a static AI-generated image can't stay editable after it's created, while a design built the right way can. A flat image can't be adjusted once it exists. It can't be adapted for a different funnel stage, updated with a new customer's logo and quote, or resized for a different channel without starting over from scratch. That rebuild cost is how a team ends up with heavy AI tool adoption and a stubbornly low C2ACR at the same time: the tools made generation faster, but every adaptation still costs a full rebuild.
Editability changes the math in three specific ways. And updates, new pricing, a new customer name, a new proof point, take minutes instead of days, which means assets stay current instead of getting quietly archived the moment they go stale.
The asset types where this matters most are the ones that show up right at a buyer's moment of decision: sales decks, one-pagers, case study PDFs, LinkedIn document posts, social proof slides. Every one of them needs enough visual polish to earn attention in the exact channel where it's competing for a few seconds of someone's focus.
Asset types that move the C2ACR needle most for B2B go-to-market teams
Not every format pulls the same weight. The hierarchy follows buyer intent at each funnel stage: the assets that convert best are the ones meeting a high-intent buyer right at the moment they're evaluating a decision, not the ones catching someone early in a scroll.
Sales decks are the clearest case study in format mattering as much as content. For C2ACR purposes, a deck only counts as converting when it produces a downstream action, a booked follow-up, a deal advancing a stage, not simply when it gets sent.
One-pagers do different work. A one-pager with a clear structure, consistent branding, and an obvious next step is the asset built to survive that moment, when nobody is there to answer questions live.
Case studies earn their keep through specificity. A named customer story on a proof slide, or packaged as a standalone case study PDF, does more conversion work than a wall of unnamed logos, because specificity is what makes social proof persuasive. Format compounds that effect: the same story structured visually as a one-pager or deck slide converts better than the identical story buried in dense paragraphs, since a prospect in decision mode is operating in a high-stimulus, low-patience environment.
LinkedIn document posts round out the list. A 2026 analysis of a large sample of business posts found native document posts recording higher average engagement than the platform-wide average, making them one of the stronger-performing formats for B2B content on LinkedIn. For C2ACR, that carousel or document post only counts as a converting asset when it drives a profile visit, a connection request, or an inbound message that actually enters the pipeline, not when it just racks up likes that go nowhere.
Building a C2ACR feedback loop into the content ops workflow
A metric that gets reported and never acted on is a vanity metric wearing a more credible outfit. C2ACR only earns its keep if it changes what a team decides to produce next.
The loop runs through four steps. Close the loop: feed the conversion data back into how future briefs get scoped, so format-fit and conversion mechanics are built in from the start instead of patched on after an asset already underperforms.
The most common way teams break this is treating C2ACR as a retrospective, something pulled together to justify what already got made. Used well, it gets reviewed at the start of a planning cycle to set priorities, not at the end to defend a quarter's output.
AI production raises the stakes on all of this. When a team can ship more assets per sprint, the signal coming back from C2ACR arrives faster too, and the teams compounding real advantage from that speed are the ones with a short distance between a conversion data point and a revised brief.
For a team building this for the first time, the starting move is small: run one quarter's retrospective audit, find whichever asset type has the steepest volume-to-conversion drop-off, fix that format before touching anything else, and measure the next quarter against this one. One bottleneck actually fixed beats a complete framework that never leaves the slide deck.